From a Stalled 2.37x Account to +97% Ad Spend at a Better Return: Building a Scalable Meta and Google Engine for BluShark Straps

Meta Ads

Google Ads

Uncover hidden growth in your campaigns with zero risk.
Complete Performance Audit
Actionable Recommendations
Custom Roadmap
5.0 stars on Upwork
Client Overview
BluShark Straps sells aftermarket watch straps direct to consumer across the US and Canada. The catalog spans NATO and sailcloth bands, rubber deployants, premium FKM, and Apple Watch fitments, at prices from $21 to $77. This was not a business that needed saving. When they came to us they were doing roughly $90,000 a month, running a real content operation with an in-house video producer, and had a loyal repeat customer base with a $68 lifetime value against a $53 average order.
What they wanted was a bigger paid channel that did not cost them their margin. Their target for the year was to grow from about $90,000 a month to $150,000 a month, on a starting budget of $25,000 a month, at a floor of 3.0 return on ad spend and a $17 target cost per purchase. The constraint mattered more than the goal, because the constraint was the thing that had already broken once.
The Challenge
BluShark had run paid ads before, with an agency. When we asked on our intake form why that ended, Andrew gave a one-line answer that turned out to be the entire brief: they were not able to increase monthly spend nor maintain 3.0 ROAS minimum. The stated definition of success for the first 90 days was equally specific, the ability to scale spend monthly by 5 to 10 percent while maintaining that 3.0 minimum.
That is a harder ask than it sounds. Efficiency at $13,000 a month is a different problem from efficiency at $32,000 a month, and most accounts pay for one with the other. Underneath it, three things were actively working against us.
The Meta account was burning the same audience
At handover the trailing 30 days showed $17,457 in spend at 2.37x, well under the 3.0 floor, with a $26 cost per purchase against a $17 target. The number that explained it was frequency: 21x. The same people were seeing the same ads twenty-one times a month. There was no headroom to spend into, because the account was not reaching anyone new.
Nearly half the Google budget was buying orders they already had
A third-party audit Andrew commissioned before we started found that 46 percent of Google spend, about $53,000 of $115,000 over the prior twelve months, was going to branded search. Branded search converts beautifully and costs almost nothing, which is exactly why it is dangerous. It props up an account average while the business stays flat, because those buyers were already looking for BluShark.
Nobody could tell which numbers were real
Attribution windows were set inconsistently between Google and Meta, so neither platform could be read against the other, and there was no independent measurement on the account at all. Every number came from the platform grading its own homework. Before we could make a single defensible scaling decision, we had to fix what we were reading.
What We Did
Rebuilt the Meta account around the frequency problem. In mid-March we relaunched retargeting on fresh audience logic (all-time purchasers, 14-day engagers, 30-day site visitors, 60-day add-to-carts, with recent purchasers excluded) and capped any single ad set at 70 percent of budget so Meta could not concentrate the whole account into two or three ads. We moved static-testing budget into catalog, where the purchase volume actually was. Within ten days the account was back above the 3.0 floor.
Pulled Google off its branded habit. The restructure went live the day we got access, aimed directly at the 46 percent concentration. Over the following months we built out non-branded coverage: Performance Max on general non-branded, Shopping on all products, and in June two new campaigns for NATO straps and sailcloth. The NATO campaign carries an odd constraint worth mentioning, since NATO is trademarked and cannot appear in ad text, so it bids the keywords without ever using the word.
Installed real attribution, then published the unflattering version of it. We put Triple Whale on the account and rebuilt the UTMs, then moved client reporting off in-platform numbers entirely. In April we started sending Andrew the full attribution spread rather than the good end of it, 2.96x view-inclusive next to 0.41x last-click, and kept sending both every month after. In July we tightened the read again for scaling decisions specifically, to first-click with view-through removed, so budget followed what won new customers rather than what looked best in a report.
Killed our own ideas when the data said to. In May we launched a max-value scaling campaign built off the 14 best-performing statics, and killed it two weeks later at roughly 1.0x, moving the budget to catalog. The Apple Watch Shopping campaign took four separate dated decisions across the engagement: paused in March, re-enabled in April with a tighter focus on premium FKM and Ultra, switched to a target-ROAS bid strategy in May, then paused again in July at 1.10x. On that same July pass we also paused the Sailcloth Shopping campaign while it was still producing at 2.36x, because all-products and Performance Max already covered that demand. Cutting a campaign that works because it is not working best is how the money gets to the right place.
Scaled on a rule instead of a feeling, and pulled back the same way. Reads every 48 to 72 hours, two or three budget moves a week, every increase gated on the return holding above 3x first. The Meta daily budget went from $465 in April to $675, then $800 to $900, then $1,100 by early July. It also came down when the read said down, with a $200 per day cut in late July and a 30 percent pullback on catalog a few days later. An account that only ever goes up is not being managed, it is being hoped at.
Told the client no on their best ad. In June Andrew asked us to point the single-strap videos at their product pages instead of the general Best Sellers page, after Nick flagged that customers were landing somewhere they did not expect. We applied it to every new video and deliberately left the top-performing ad alone, because relinking an ad resets it and wipes the comments, shares and likes that are a large part of why it converts. We walked through that tradeoff rather than just doing what we were told.
The Results
All figures below cover February 23 to August 2, 2026. Meta figures are Meta-attributed on a 1-day view, 7-day click, 1-day engaged-view window. Google figures are Google-attributed conversion value, read directly out of the Google Ads account on August 3, 2026 and matching the reporting dashboard to the cent.
On Meta, $99,669.81 in spend produced $343,189.42 in attributed revenue:
3.44x purchase ROAS across the engagement, against a 3.0 floor and a 2.37x starting point
5,785 purchases at a $17.23 cost per purchase, against the client's own $17.00 target. Every month from May onward came in under target; the 23-cent overage is the inherited early months at $22 to $24 sitting inside the average
Average order value up to $59.32 from the $53 they reported at intake
7.3M impressions, 1.16M reach, 135,708 clicks at a 1.85% CTR and $0.73 CPC
The monthly trend is the part that answers the original brief. Meta spend and Meta return rose together: $16,972 at 2.57x in March, $13,006 at 2.91x in April, $13,109 at 3.36x in May, $19,315 at 4.25x in June, and $32,091 at 3.74x in July. Cost per purchase fell across the same stretch, from $22.48 in March to $15.80 in July.
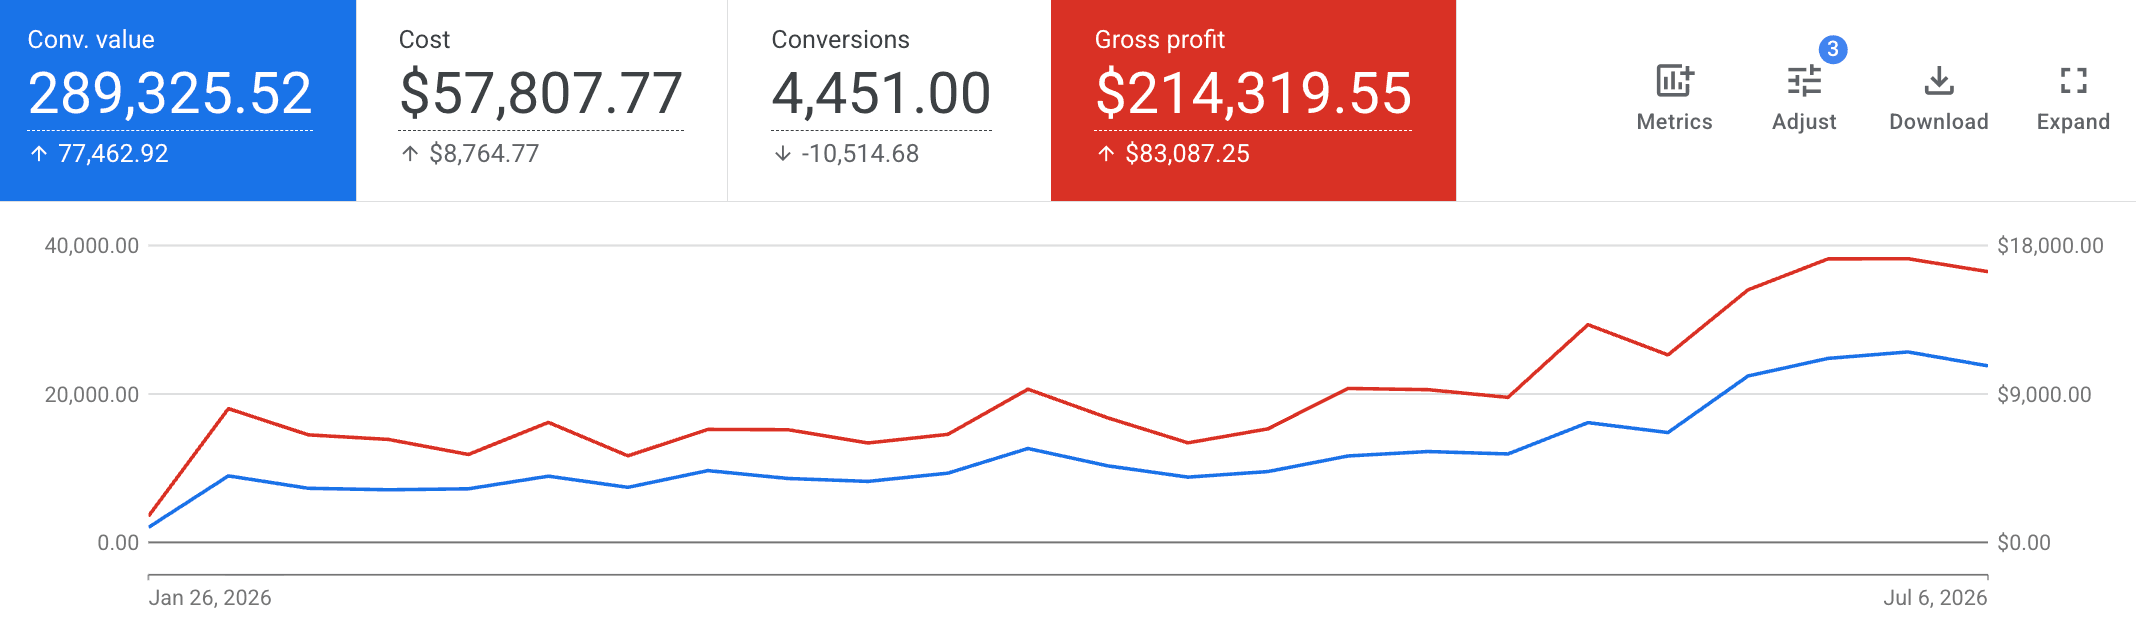
On Google, $61,948.11 in cost produced $327,193.69 in conversion value:
5.28x return across the engagement
4,943 conversions at a $12.53 cost per conversion
87,733 clicks at a 1.50% CTR and a $0.71 average CPC
Monthly return climbed from 4.88x in March to 6.24x in June and 6.23x in July, while monthly cost rose from $7,807 to $16,031 and cost per conversion fell from $12.76 to $10.89
Put the two platforms side by side between May and July and the tradeoff is visibly broken. Combined monthly ad spend went from $24,426 to $48,122, a 97 percent increase. Over the same two months Meta went from 3.36x to 3.74x with cost per purchase down $1.68, and Google went from 4.36x to 6.23x with cost per conversion down $4.30. Nearly twice the money going in, better efficiency on both platforms coming out.
One note on what the 5.28x actually contains, because the honest version is more useful than the flattering one. The two branded Google campaigns return 8.33x and 12.93x, which is what branded search always does. The two campaigns we put the most money into, general non-branded Performance Max and all-products Shopping, return 4.33x and 3.62x. Lower, on purpose, because that is where new customers come from. Moving spend there pulls the account average down while pushing the business up, and it is the direct answer to the 46 percent branded concentration we inherited. Andrew asks for that split every month, and we would rather show a smaller number we can defend than a bigger one that just means we bought back demand the brand already had.
There is also no single combined return figure anywhere in this case study, and that is deliberate. Summed across platforms, $161,617.92 in spend is associated with $670,383.11 in platform-attributed revenue, but Meta and Google both take credit for some of the same orders, so adding them overstates the total. A real blended number needs store-side revenue. Until we have it we report per-platform figures rather than a nicer-looking sum, for the same reason we put the 0.41x last-click number in front of Andrew next to the 2.96x back in April.
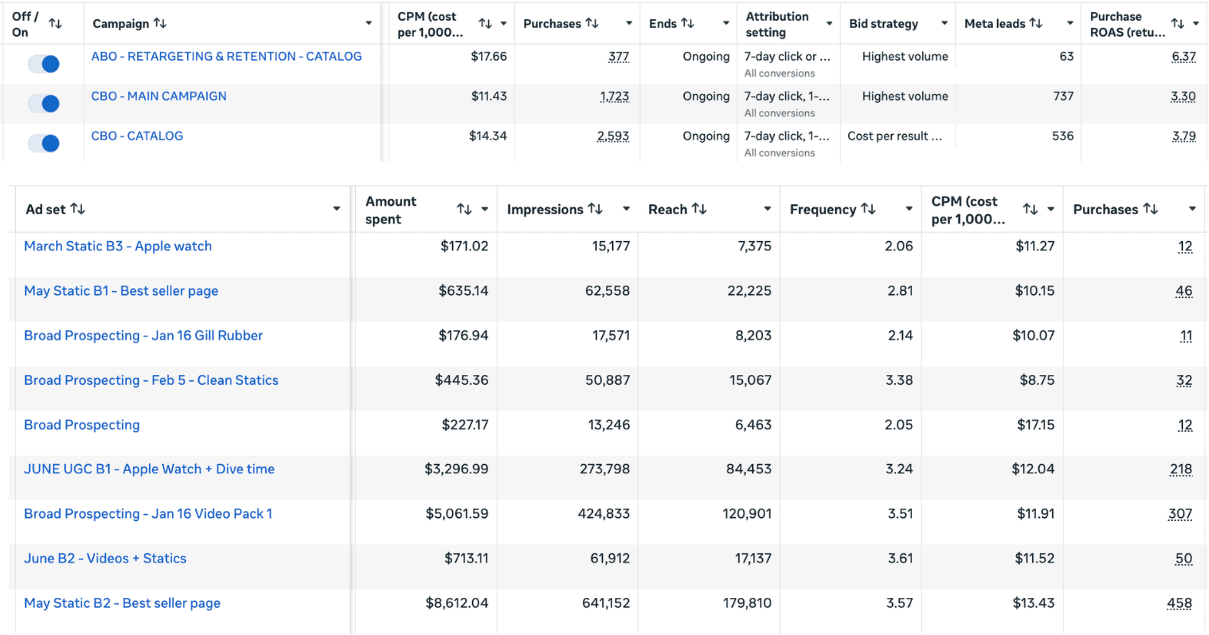
Top-Performing Creative

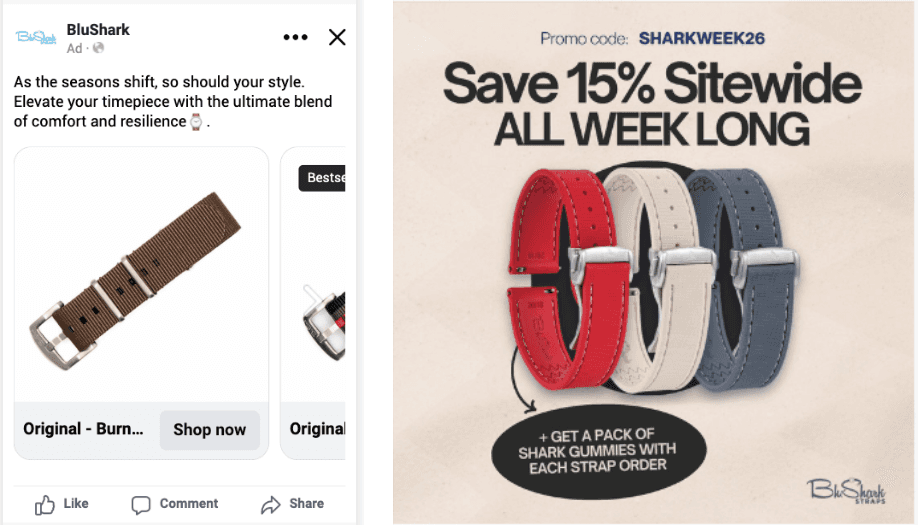
Two things are worth pulling out of that list. The Sailcloth Rubber Deploy video runs a 3.44 percent CTR against an account average of 1.85 percent, the highest of any ad on the account, which says the strap-in-motion format earns attention that the catalog formats do not. And the rebuilt retargeting campaign returned 6.31x at $9.72 per purchase on $4,148.51 of spend, which is the March audience work showing up as money.
[ Insert screenshot: Meta top ads by spend with ROAS, purchases and cost-per-purchase columns ] [ Insert screenshot: Sailcloth Rubber Deploy video ad beside its 3.44% CTR and the 1.85% account average ]
Key Outcomes
Raised combined monthly ad spend 97 percent between May and July 2026, from $24,426 to $48,122, with the return improving on both platforms rather than degrading
Took Meta from an inherited 2.37x to 3.44x across the engagement, holding above the client's 3.0 floor every month from May onward
Delivered a $17.23 cost per purchase against the client's own $17.00 target, down from $26 at handover
Fixed a 21x frequency problem with an audience rebuild and a 70 percent per-ad-set budget cap, creating the headroom that made scaling possible at all
Shifted Google spend off a 46 percent branded concentration and into non-branded acquisition, with the two largest campaigns by cost now both non-branded
Ran Google at 5.28x across the engagement, with monthly return climbing from 4.88x in March to 6.23x in July as monthly cost roughly doubled
Built independent attribution where there was none, and reported the unflattering view of it alongside the flattering one every month
Paused or killed four campaigns on evidence, including our own scaling campaign after two weeks and a Sailcloth campaign that was still profitable at 2.36x
The Bottom Line
BluShark did not need a better return. They needed an account that could get bigger without getting worse, which is a different job and a harder one. In the first five months we rebuilt Meta off a frequency problem that left nowhere to grow, pulled Google off a branded habit that was buying orders the brand had already earned, and put independent measurement under both so the decisions had something honest to stand on.
Then we scaled it. Monthly spend up 97 percent between May and July, Meta at 3.44x and Google at 5.28x across the engagement, both above the 3.0 minimum the previous agency could not hold at any budget. Along the way we killed our own scaling campaign after two weeks, paused a Google campaign that was still producing because something else covered it better, and cut the budget twice in late July when the read said cut.
Worth saying plainly: these months are BluShark's seasonal peak, September and October are their low season, and July is not a permanent run rate. The durable result is not the July figure. It is an account that now scales and pulls back on evidence, which is what carries a business through a slow quarter.
Related Case Studies


View Case
Legal
How JumpstartROI Helped Dike Law Group Reach Its First Seven-Figure Year


View Case
Finance
Scaling A Quiz Funnel for M&A Advisory Dropped Cost Per Lead to a Third
Meta Ads


View Case
B2B
From $200–$300 Per Lead to $90: How We Rebuilt CEO Life's Member Acquisition in the Most Expensive Markets in the Country
Meta Ads